How to Read Nutrition Labels Like a Pro
⚠️ Disclaimer: The information in this article is for general educational purposes only and does not constitute medical, nutritional, or professional fitness advice. Individual results may vary. Always consult a qualified healthcare professional or certified fitness trainer before starting any new exercise program, changing your diet, or making decisions about injury treatment or recovery. If you experience pain, discomfort, or any unusual symptoms during exercise, stop immediately and seek professional guidance.

Why Reading Nutrition Labels Matters More Than You Think
Most people glance at nutrition labels occasionally — checking calories when dieting, looking at protein when bulking, scanning fat when trying to “eat healthy.” Very few people actually know how to read a nutrition label with the systematic fluency that transforms food shopping from guesswork into informed decision-making. This fluency gap has meaningful consequences: it makes it possible to be genuinely confused about what you’re eating, to be manipulated by marketing claims that have no relationship to actual nutritional value, and to make dietary changes that feel productive but don’t produce the outcomes you’re working toward.
I learned to read nutrition labels properly from a registered dietitian after spending two years tracking macros from memory and wondering why my numbers never seemed to add up. The education revealed multiple systematic errors in how I was estimating portion sizes, interpreting serving information, and evaluating the actual nutritional quality of products I’d assumed were healthy based on their front-of-package marketing. The label reading skills I developed changed how I shop, how I eat, and how I evaluate nutritional information claims in media and marketing. They’re among the most practically useful nutritional competencies I’ve acquired.
The Regulatory Framework: What Labels Are Required to Show
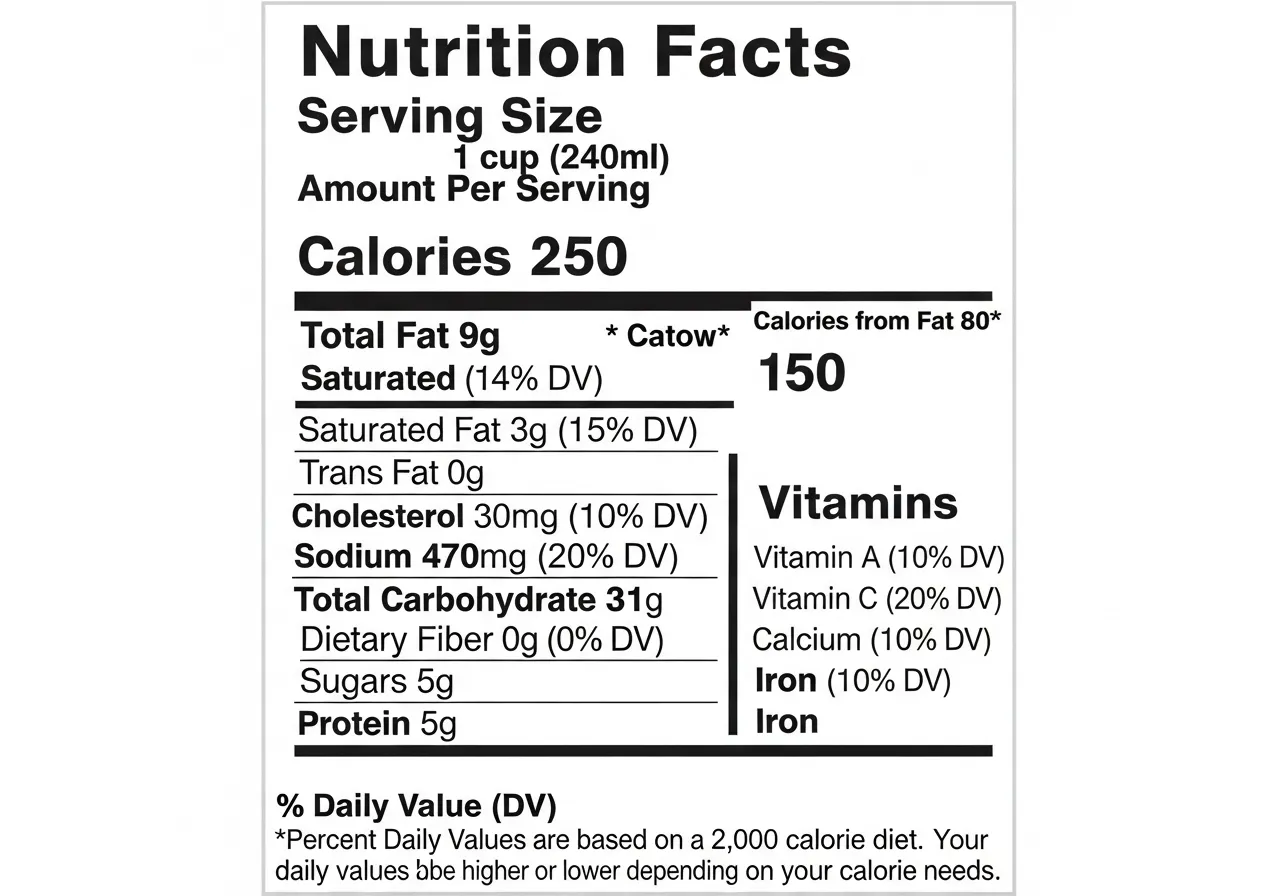
In the United States, nutrition labels on packaged foods are regulated by the Food and Drug Administration (FDA) under the Nutrition Labeling and Education Act. The current label format, updated in 2020, requires disclosure of: serving size, servings per container, calories per serving, total fat (with saturated and trans fat broken out), cholesterol, sodium, total carbohydrates (with dietary fiber and total sugars broken out, including added sugars), protein, and the following vitamins and minerals: vitamin D, calcium, iron, and potassium. Vitamins A and C, previously required, were removed from mandatory disclosure in the 2020 update because deficiency in these nutrients is now less prevalent. All percentages are expressed as a Percent Daily Value (%DV) based on a 2,000-calorie reference diet.
Understanding what the regulations require, and what they don’t, is as important as reading the labels themselves. Labels are not required to disclose every nutrient — only the ones listed above. A food can contain significant amounts of other nutrients (both beneficial and concerning) without disclosing them. Labels are also not required to distinguish between naturally occurring and added sodium, which matters because the food matrix context of naturally occurring sodium differs from industrially added sodium.
Why Labels Alone Don’t Tell the Complete Story
Nutrition labels provide quantitative information about isolated nutrients but say nothing about the food matrix — the biological context in which those nutrients exist and are absorbed. Two foods with identical protein content on the label will have different actual protein bioavailability depending on amino acid composition and digestibility. Two foods with identical fat content will have dramatically different effects on cardiovascular and hormonal health depending on the fatty acid profile — which the basic label only partially reveals. Two foods with identical calorie content will have different effects on satiety, blood glucose, and metabolic rate depending on their fiber content, protein content, and the complexity of their carbohydrate structure.
This limitation is not a reason to ignore labels — it’s a reason to use them as one of multiple evaluation tools rather than as the complete picture. Labels answer the quantitative “what and how much” questions; the ingredients list (discussed in the next section), food category knowledge, and overall dietary pattern context are needed to answer the qualitative “what does this mean for my health” questions that labels alone cannot address. The FDA’s comprehensive guide to nutrition labels provides the regulatory baseline from which this article builds a more practical, performance-oriented reading framework.
The Fitness Context: Why Athletes Need Different Label Literacy
General nutrition label reading skills are valuable for everyone, but athletes and people training for body composition goals need a more specific skill set focused on the metrics most relevant to training nutrition: protein quantity and quality, carbohydrate type and timing implications, energy density relative to volume and satiety, and the identification of ingredients that may undermine training goals (excessive added sugars, trans fats, inflammatory seed oils). This article is specifically designed for the fitness and body composition context, focusing on the label metrics and reading strategies most relevant to people who train and care about body composition outcomes.
The Evolution of Nutrition Labeling: Why Current Labels Look the Way They Do
The current nutrition facts panel format, updated by the FDA in 2016 and fully implemented by 2020, reflects decades of nutrition science evolution and public health policy development. The original nutrition label introduced in 1990 focused on fat and cholesterol — reflecting the dominant nutritional concerns of that era. The 2020 update made calorie count more prominent (larger font), added the added sugars line (reflecting growing scientific consensus on the distinct health concerns of added vs. naturally occurring sugars), updated serving sizes to better reflect actual consumption patterns, and removed vitamins A and C from mandatory disclosure while adding vitamin D and potassium — a shift reflecting changed deficiency patterns in the US population over the intervening decades.
Understanding this evolutionary context helps explain why certain nutrients appear prominently on labels while others don’t: label requirements reflect both nutritional science and regulatory priorities at the time of their establishment. Emerging nutritional concerns — the omega-6 to omega-3 ratio, specific fiber types, the distinction between different fatty acid subtypes — are not fully captured in current label requirements, which is why ingredient list literacy and broader nutritional education remain essential complements to label reading.
How Front-of-Package Systems Differ Internationally
The US nutrition facts panel is one of several international approaches to food labeling, and comparing systems illuminates what the US approach emphasizes and what it leaves to consumer interpretation. The UK traffic light system colors key nutrients (fat, saturated fat, sugar, salt) red, amber, or green based on the amount per serving relative to recommended limits — providing a rapid visual quality signal that requires no calculation. Chile’s mandatory black warning labels (high in sugar, high in sodium, high in saturated fat, high in calories) appear prominently on the front of any product exceeding threshold levels — a direct warning system that research has shown to reduce purchases of labeled products. Australia uses the Health Star Rating — a summary score from 0.5 to 5 stars on the front of packaged foods based on a nutrient profiling algorithm. Each system reflects different regulatory philosophies: information provision (US), visual guidance (UK traffic lights), explicit warning (Chile), and summary scoring (Australia). No system is complete, and each has blind spots. The common lesson across all systems is that raw nutrient data requires interpretation context to be actionable — which is exactly what comprehensive label literacy provides.
Why Most People Never Develop True Label Literacy
Despite widespread awareness that nutrition labels exist and provide useful information, most people never develop systematic label reading competency. Research on consumer behavior at the point of purchase shows that the majority of food purchases are made based on brand familiarity, packaging, price, and front-of-package claims rather than nutrition facts panel data. Even people who report checking labels regularly typically check only one or two metrics — usually calories and sometimes fat — while ignoring the ingredients list and the broader nutritional picture that would enable genuinely informed decision-making.
The barriers to label literacy are real: labels contain substantial information in small print with technical terminology; time pressure during shopping creates resistance to systematic evaluation; and the cognitive load of evaluating dozens of products per shopping trip makes thorough label reading feel impractical. The skills in this article are specifically designed to make label reading faster and more systematic — reducing the time required for accurate product evaluation through a prioritized framework that extracts the most decision-relevant information first. The investment in building these skills is front-loaded: 4–6 weeks of deliberate practice produces the pattern recognition and mental product database that makes ongoing label reading efficient and nearly automatic.
The Nutrition Facts Panel: Every Section Decoded
The nutrition facts panel is the standardized, regulation-mandated section of the food label that provides quantitative nutritional information. Each element of the panel has specific meaning and practical implications for training nutrition. Understanding every section — not just the ones you habitually check — provides a complete picture of what the product actually contains.
Serving Size and Servings Per Container: The Foundation Everything Else Depends On
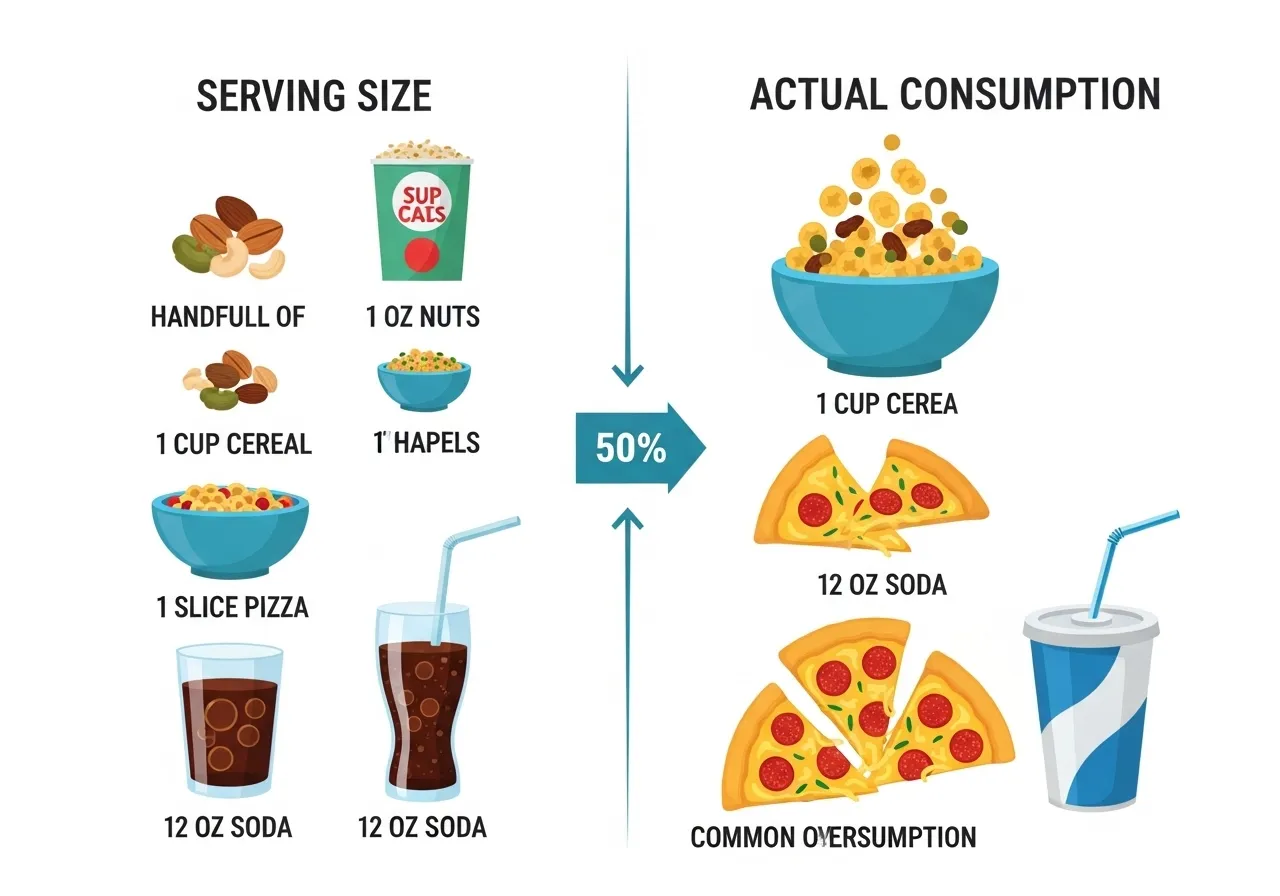
Serving size is the most important — and most misused — element of the nutrition facts panel. Every number on the panel is calculated per serving, not per package. A package of crackers showing 150 calories may contain 4 servings — meaning consuming the entire package provides 600 calories. This is not accidental: the FDA requires serving sizes to reflect amounts typically consumed, but “typically consumed” is defined by manufacturer survey data that often reflects aspirational rather than actual consumption patterns for energy-dense, palatable foods.
The 2020 label update required manufacturers to update serving sizes to more closely reflect actual consumption patterns — leading to some products (like ice cream) showing larger serving sizes than the previous label. However, the incentive structure for manufacturers still favors smaller-appearing serving sizes for less healthy products. The practical skill: always calculate total nutritional content of what you will actually consume, not just what the label defines as a “serving.” If you will eat half the package, multiply all values by the number of servings in that half. If the label says “about 2.5 servings” and you’ll consume the whole package, multiply every number by 2.5.
Calories: The Right Way to Interpret This Number
Calories on the nutrition label represent metabolizable energy — the portion of total energy in the food that the human body can actually extract and use. This is already adjusted from the total combustion energy measured in a calorimeter (the “gross energy”) to account for digestive inefficiency and fecal losses. For most people tracking calories for body composition, the label calorie count is a reasonable working estimate, with two important caveats: protein calories are slightly overestimated on labels (because protein has a higher thermic effect than the 4 cal/g used in labeling calculations), and fiber calories are understated (because bacterial fermentation of fiber in the colon produces some short-chain fatty acids that provide energy the label does not account for).
These discrepancies are modest for most dietary patterns and don’t warrant manual correction for most practical purposes. However, they explain why very high-protein diets sometimes produce more fat loss than calorie calculations would predict, and why high-fiber diets provide somewhat less net energy than labels suggest. For athletes tracking macros carefully, these systematic label biases are worth being aware of as one explanation for why actual outcomes sometimes diverge from mathematical predictions.
The Macronutrient Breakdown: Fat, Carbohydrates, and Protein
Total fat is broken into saturated, trans, and (on updated labels) sometimes polyunsaturated and monounsaturated fat. Trans fat deserves specific attention: artificial trans fats (partially hydrogenated oils) have been phased out in the US food supply following FDA action, but labels can show “0g trans fat” while still containing up to 0.5g per serving — which adds up if multiple servings are consumed. Check the ingredients list for “partially hydrogenated” oils even when the trans fat line shows zero. Natural trans fats (conjugated linoleic acid from ruminant animals) behave differently from artificial trans fats and are not a health concern at typical dietary exposure levels.
Total carbohydrates includes dietary fiber, total sugars, and added sugars. Dietary fiber should be subtracted from total carbohydrates to get “net carbs” — the carbohydrates that affect blood glucose — which is the relevant number for blood sugar management and low-carbohydrate dietary approaches. Total sugars includes both naturally occurring sugars (in fruit, dairy) and added sugars. The added sugars line, added in the 2020 label update, is particularly useful for evaluating products marketed as healthy — many “health” foods derive a substantial portion of their sweetness from added sugars that are indistinguishable from sugars in less healthy products.
Protein is stated in grams per serving. For athletes specifically, the protein number is one of the most important on the label, but it should be evaluated alongside the ingredients list to assess protein quality — a protein bar with 20g of protein from collagen peptides provides dramatically inferior amino acid quality for muscle protein synthesis compared to 20g from whey or casein, yet both show “20g protein” on the label. For protein-dense whole foods, the label protein number is reliable; for processed protein products, the source matters as much as the quantity.
Micronutrients: Vitamin D, Calcium, Iron, and Potassium
The four micronutrients now required on nutrition labels — vitamin D, calcium, iron, and potassium — were selected because they are most commonly insufficient in the average American diet. Their presence in a food at meaningful Percent Daily Value levels (10%+ DV) adds genuine nutritional value beyond macronutrients. However, their absence from the label doesn’t mean the food is micronutrient-poor — the label only discloses the four required minerals, leaving many valuable micronutrients (magnesium, zinc, B vitamins, selenium, and others) off the mandatory disclosure list. A food’s overall micronutrient density requires evaluating its ingredient composition, not just its label disclosures.
The Difference Between Total and Net Carbohydrates
For athletes and people managing carbohydrate intake for body composition or metabolic health, the distinction between total carbohydrates and net carbohydrates is practically significant. Total carbohydrates on the label include all carbohydrate fractions: starch, sugars, and dietary fiber. Net carbohydrates — a concept widely used in low-carbohydrate nutrition communities — subtract dietary fiber and in some frameworks sugar alcohols from total carbohydrates, because these fractions have minimal impact on blood glucose compared to digestible starches and sugars.
The net carb calculation is straightforward: total carbohydrates minus dietary fiber equals net carbs. For most whole foods with significant fiber (vegetables, legumes, whole grains), the difference between total and net carbs is meaningful — a cup of black beans shows 41g total carbs but only 26g net carbs after subtracting 15g of fiber. For most processed foods with minimal fiber, the difference is negligible. Sugar alcohols (erythritol, xylitol, sorbitol, maltitol — identifiable in the ingredients list by the “-ol” suffix or disclosure on some labels) vary in their blood glucose impact: erythritol is nearly completely absorbed and excreted without metabolic effect and can be fully subtracted; maltitol raises blood glucose at approximately 50% the rate of sugar and should only be partially subtracted. Labels that prominently display “net carbs” on the front of package are primarily found on low-carbohydrate products and may use subtraction methods that overstate the blood glucose advantage of the product.
Tracking Apps and Label Scanning: Digital Extensions of Label Literacy
Nutrition tracking applications have transformed label literacy from a purely manual skill into a digitally augmented practice. Apps like MyFitnessPal, Cronometer, and Lose It allow barcode scanning that instantly retrieves comprehensive nutritional data for packaged foods — often including nutrients beyond the mandatory label disclosures, drawn from the USDA FoodData Central database and user-submitted data. This digital extension of label reading is particularly valuable for athletes tracking macros precisely, since it eliminates the calculation errors that arise from manual tracking and provides the full nutritional picture including micronutrients not disclosed on the physical label.
The limitation of database-dependent tracking is data accuracy: user-submitted entries in apps like MyFitnessPal can contain errors, and database data may lag behind product reformulations that change the actual nutritional content. Verifying scanned results against the physical label for key metrics (calories, protein, carbohydrates) catches the most consequential errors. For whole foods without barcodes — fresh produce, bulk items, home-cooked meals — the USDA FoodData Central database provides the most authoritative nutritional data available and can be queried directly through the FoodData Central website or via apps that integrate the database. Building a hybrid practice — digital scanning for packaged items, database lookup for whole foods — provides the most comprehensive and accurate nutritional tracking available to non-laboratory nutrition assessment.

Ingredients Lists: What to Look For and What to Avoid
The ingredients list is the most informative and most underutilized section of any food label. While the nutrition facts panel tells you the quantitative what — how many grams of fat, carbohydrates, protein — the ingredients list tells you the qualitative what and why: what specific substances are in the product, in what relative proportions, and with what implications for health and performance. Developing competence at reading ingredients lists transforms food evaluation from a macro-counting exercise into a genuine assessment of food quality.
The Ingredients List Rule: Order Matters
Ingredients are listed in descending order by weight — the ingredient present in the largest amount by weight is listed first, and the ingredient present in the smallest amount is listed last. This ordering has powerful implications for product evaluation. A bread listing “whole wheat flour” as the first ingredient is predominantly made from whole wheat flour. A bread listing “enriched wheat flour” first and “whole wheat flour” third is primarily white flour with smaller amounts of whole wheat — despite “whole grain” claims on the front of the package. The front-of-package marketing claims and the ingredients list frequently tell different stories, and the ingredients list is the accurate one.
Ingredient quantity is somewhat obscured by the practice of “ingredient splitting” — a technique where manufacturers list multiple forms of the same ingredient separately to push each further down the list. Listing “sugar, corn syrup, high fructose corn syrup, dextrose, maltose” as separate ingredients moves each individual sugar source lower in the list, even though the combined total might make sugar the largest ingredient by weight. Recognizing ingredient splitting — particularly for sugars, which have dozens of alternative names — is an important advanced label reading skill.
The 50+ Names for Added Sugar
Sugar is added to the food supply under more than 50 different names, making it easy for manufacturers to obscure total added sugar content through the ingredient splitting described above. The most common include: sucrose, glucose, fructose, high fructose corn syrup, corn syrup, maltose, dextrose, lactose, honey, agave, maple syrup, molasses, fruit juice concentrate, evaporated cane juice, brown rice syrup, barley malt syrup, and tapioca syrup. While the added sugars line on the nutrition facts panel now totals all forms of added sugar, the ingredients list reveals specifically which sugar forms are present — relevant because different sugars have different metabolic profiles. Fructose (in high fructose corn syrup and agave) is metabolized primarily by the liver and at high intake levels is associated with fatty liver and impaired lipid metabolism in a way that glucose-dominant sugars are not.
Fats in the Ingredients List: Desirable and Problematic Oils
The fat sources in the ingredients list reveal the fatty acid profile of the product in ways that the “total fat” line on the nutrition facts panel cannot. Look for: olive oil, avocado oil, coconut oil, and butter as relatively unprocessed fat sources with favorable or at least neutral health profiles at reasonable intake levels. Be cautious of: soybean oil, corn oil, sunflower oil, safflower oil, and canola oil — collectively called “seed oils” — which are high in omega-6 polyunsaturated fatty acids. At the ratios present in the modern Western food supply, these oils contribute to elevated omega-6 to omega-3 ratios that promote systemic inflammation. For athletes seeking optimal inflammatory balance to support recovery, minimizing seed oil-heavy processed foods and favoring whole food fat sources is a reasonable practical approach. Check the ingredients list for “partially hydrogenated” as an indicator of residual artificial trans fats regardless of what the trans fat label shows.
Additives, Preservatives, and Artificial Ingredients
The modern food supply contains hundreds of approved food additives — preservatives, emulsifiers, stabilizers, artificial colors, and flavors — that appear on ingredients lists under chemical names. Most additives at regulatory-approved exposure levels are considered safe by regulatory agencies including the FDA and EFSA (European Food Safety Authority). However, some specific additives have accumulated enough research concern to warrant awareness: carrageenan (associated with gastrointestinal inflammation in some research), carboxymethylcellulose and polysorbate 80 (emulsifiers associated with microbiome disruption at high intake levels in animal research), and artificial food dyes (associated with behavioral effects in children in some studies, though evidence in adults is limited). The Environmental Working Group’s Food Scores database provides detailed additive assessments for thousands of products for those who want to investigate specific ingredients beyond what this article covers. For most athletes, the practical guidance is: shorter ingredients lists with recognizable whole food components are generally preferable to longer lists with many chemical additives, and minimizing heavily processed foods naturally reduces additive exposure to levels where specific additives become less of a concern.
Organic vs. Conventional: What the Label Actually Guarantees
The USDA Organic seal guarantees specific production standards but does not guarantee superior nutritional content, safety, or health outcomes in all cases. For produce, organic certification means production without synthetic pesticides, synthetic fertilizers, or genetic engineering. Research on pesticide residues consistently shows that organic produce has lower detectable pesticide residues than conventional equivalents — a meaningful consideration for produce categories where conventional pesticide residue levels are highest (strawberries, spinach, kale, peaches, apples, and other “dirty dozen” crops). For produce with thick skins that are removed before eating (avocados, pineapples, onions, mangoes), the pesticide residue difference between organic and conventional is negligible and the premium may not be justified.
For processed organic products, the certification applies to the organic ingredients within the product but does not transform an inherently low-quality product into a healthy one. Organic sugar is still added sugar with identical metabolic effects. Organic refined flour is still nutritionally inferior to whole grain flour regardless of certification. Organic sodium is still sodium. Evaluating processed organic products by the same nutrition facts panel and ingredients list criteria as conventional products is essential — the organic label is a production method certification, not a nutritional quality endorsement.
Children’s Food Products: Special Label Reading Considerations
Products marketed to children and families deserve particular label scrutiny because they represent one of the most heavily marketed and most nutritionally compromised categories in the food supply. Character licensing, bright colors, “fun” shapes, and claims like “made with real fruit” or “a good source of calcium” on children’s cereals, snack foods, and beverages frequently obscure nutritional profiles that would be immediately identified as poor if the same products were marketed to adults. A children’s breakfast cereal claiming to be “a good source of whole grain” may list sugar as its first or second ingredient and contain 10–12g of added sugar per serving — more than a standard cookie. Applying the same ingredient list evaluation to children’s products as to adult products, while giving no credence to character-based marketing or child-specific health claims, produces more accurate nutritional assessment than evaluating these products on their own terms.
Serving Sizes, Daily Values, and the Numbers That Actually Matter
The Percent Daily Values (%DV) on nutrition labels are among the most useful and most misunderstood elements of the label. They provide a context for the absolute gram or milligram quantities — answering “is this a lot or a little of this nutrient?” in a standardized way. Using %DV correctly requires understanding what the reference diet is based on and how to adjust the numbers for your individual caloric and nutritional needs.
How Percent Daily Values Work
All %DV on nutrition labels are calculated based on a 2,000-calorie reference diet. This is a regulatory convenience — actual caloric and nutritional needs vary substantially by body size, age, sex, and activity level. An athlete consuming 3,000 calories per day needs 50% more of most nutrients than the 2,000-calorie reference, meaning that a food providing “20% DV” of a nutrient provides only approximately 13% of that athlete’s actual daily need. Conversely, a sedentary person consuming 1,600 calories needs less than the 2,000-calorie reference, and the same food provides closer to 25% of their actual daily need. Understanding that %DVs are reference-based, not personally calibrated, allows you to scale them to your individual intake level.
The FDA’s simple heuristic for interpreting %DV: 5% or less is considered low for a given nutrient; 20% or more is considered high. This applies in both directions — for nutrients you want more of (fiber, protein, vitamins, minerals), 20%+ DV is a positive indicator. For nutrients typically consumed in excess in the Western diet (sodium, saturated fat, added sugars), 20%+ DV means the product is a high source of that nutrient and should be consumed with awareness of its contribution to daily total.
Sodium: The Most Important Nutrient to Track on Labels
Sodium is the nutrient most consistently over-consumed relative to recommendations in the Western diet, and processed and packaged foods are the primary source — accounting for approximately 70–75% of total dietary sodium intake according to research reviewed by the CDC’s sodium reduction initiative. The recommended daily sodium intake is 2,300 mg for most adults. A single bowl of canned soup may contain 800–1,000 mg. A single serving of frozen meal may contain 1,000–1,400 mg. Without awareness of sodium in processed foods, it is entirely possible to consume 4,000–5,000 mg daily while eating products marketed as healthy.
For athletes, sodium management has nuance beyond general population guidance. Sweat sodium losses during exercise — which can reach 1,000–3,000 mg per hour during intense endurance exercise — must be replenished for optimal performance and recovery. Athletes with high training volumes in hot conditions may need higher sodium intakes than the 2,300 mg general recommendation. However, even athletes with elevated sodium needs should be aware of their dietary sodium distribution — the goal is to get adequate sodium, not unlimited sodium, and replacing sweat losses specifically with electrolyte beverages and salty whole foods is more targeted than simply ignoring sodium on labels.
Fiber: The Underconsumed Nutrient Worth Actively Tracking
Dietary fiber is chronically underconsumed in Western diets — the average American consumes approximately 15 grams per day against a recommendation of 25–38 grams. Fiber provides multiple benefits relevant to athletes: it supports gut microbiome diversity that influences immune function and inflammation, it slows carbohydrate digestion (beneficial for blood glucose management at meals not immediately pre-workout), it supports satiety and helps manage caloric intake during fat loss phases, and specific fibers (particularly beta-glucan from oats and soluble fiber from legumes) have well-documented cardiovascular health benefits. Using %DV to seek high-fiber foods — products with 20%+ DV are excellent fiber sources — is one of the most impactful nutritional decisions a label reader can make for long-term health.
Protein: What the Label Tells You and What It Doesn’t
The protein line on nutrition labels shows total protein in grams — but says nothing about protein quality, which is equally important for muscle protein synthesis. High-quality proteins contain all essential amino acids in proportions that support muscle protein synthesis — specifically, adequate leucine (the primary trigger for mTOR-mediated muscle protein synthesis), and a balanced essential amino acid profile. Animal proteins (meat, fish, eggs, dairy) are uniformly high quality. Plant proteins vary: soy is high quality, while individual grains and legumes are incomplete (deficient in specific essential amino acids) but can be combined across the day to provide complete amino acid coverage. Products containing primarily collagen protein (often appearing as “hydrolyzed collagen” or “collagen peptides” in ingredients) show substantial protein on the label but are nearly devoid of leucine and tryptophan, making them among the lowest quality protein sources despite their impressive gram counts.
Reading Labels for Micronutrient Density: Beyond the Required Disclosures
The four micronutrients required on current nutrition labels — vitamin D, calcium, iron, and potassium — represent only a small fraction of the micronutrients relevant to athletic performance and health. Magnesium, zinc, B vitamins (thiamine, riboflavin, niacin, B6, B12, folate), vitamin K, selenium, copper, and manganese are all nutritionally important and are not required disclosures on standard labels. Recognizing the ingredient and food category clues that indicate micronutrient density beyond the label disclosures extends label literacy to a more complete nutritional assessment.
Dark leafy greens (identifiable in ingredients as spinach, kale, chard, collards) signal magnesium, vitamin K, and folate density. Whole grain ingredients signal B vitamins and magnesium. Legumes (lentils, beans, chickpeas) signal folate, iron, magnesium, and zinc. Nuts and seeds signal magnesium, zinc, selenium, and vitamin E. Animal proteins signal B12, zinc, and bioavailable iron. Recognizing these ingredient-micronutrient associations allows a rough assessment of the micronutrient density of a product from the ingredients list even when the specific micronutrients are not disclosed. A product with a short ingredients list of whole food components containing dark greens, whole grains, and legumes is almost certainly more micronutrient-dense than a product with an equivalent label disclosure but an ingredients list dominated by refined flours, industrial oils, and additives.
Restaurant and Prepared Food Labeling: Extending Skills Beyond the Grocery Store
The Affordable Care Act requirement that chain restaurants with 20 or more locations display calorie counts on menus extended the reach of nutrition labeling beyond packaged foods. Restaurant calorie counts provide a useful anchor for energy awareness, though they have significant limitations: they represent average values for standardized recipes that vary in actual preparation, they don’t disclose the full nutrient profile, and portion consistency in restaurant kitchens varies. Using restaurant calorie information as a rough order-of-magnitude guide — recognizing that displayed values may vary 20–30% from actual — is reasonable; using them for precise tracking is not. For athletes making frequent restaurant dining decisions, developing intuitive estimates based on ingredient and portion knowledge — a skill built through sustained label reading practice — is ultimately more reliable than menu calorie displays for most practical nutritional management purposes.

Misleading Marketing Claims and How to See Through Them
The front of a food package is prime real estate that manufacturers use for marketing claims designed to influence purchase decisions. Many of these claims are technically true but practically misleading — they create impressions of healthfulness that the actual nutritional content doesn’t support. Developing the ability to evaluate front-of-package claims critically, always verifying against the nutrition facts panel and ingredients list, is the defining skill that separates an informed food consumer from a marketing target.
“Natural” and “All Natural”: Meaningless Regulatory Categories
The claim “natural” or “all natural” on a food label has no legal definition in the United States. The FDA has never formally defined what “natural” means for food labeling, meaning manufacturers can apply the claim to essentially any product without regulatory consequences. Products containing high fructose corn syrup, refined sugars, industrial seed oils, and long lists of additives are regularly labeled “all natural.” The presence of this claim on a package provides zero reliable information about the product’s nutritional quality and should be completely disregarded in product evaluation. Always read the ingredients list and nutrition facts panel regardless of natural claims on the front.
“Low Fat”: When Less Fat Means More Sugar
The low-fat food movement of the 1980s and 1990s produced a generation of products that removed fat — which provides flavor, texture, and satiety — and replaced it with sugar, refined starch, and artificial additives to maintain palatability. The result was products with technically lower fat that often had higher total caloric content, higher added sugar, and reduced satiety compared to their full-fat predecessors. This pattern persists in many products today. “Low fat” flavored yogurt, for example, often contains more added sugar per serving than full-fat unsweetened versions. Always check total calories, added sugars, and ingredients when evaluating low-fat products — the fat reduction is not automatically a nutritional improvement when it is compensated with sugar.
“High Protein” Products: Quantity vs. Quality
The “high protein” marketing claim on packaged foods requires evaluation of both quantity and quality. As discussed in the previous section, products can technically claim high protein while deriving that protein from collagen, gelatin, or plant-protein isolates with inferior amino acid profiles. Look at the ingredients list to identify the specific protein sources in a “high protein” product. For muscle building purposes, whey, casein, egg, and complete plant proteins (soy, pea-rice combination) support muscle protein synthesis in ways that collagen-dominant or low-quality mixed-protein products cannot, regardless of their gram count on the label.
“Zero Sugar” and “Sugar-Free”: What’s Actually In There
Zero sugar and sugar-free products replace the sweetness of sugar with non-caloric sweeteners — artificial (aspartame, sucralose, acesulfame potassium, saccharin) or natural (stevia, monk fruit). From a caloric standpoint, these replacements provide sweetness without the energy content of sugar. From a broader health standpoint, the research picture is more nuanced: some research suggests that artificial sweeteners disrupt gut microbiome composition and may influence insulin sensitivity and appetite regulation through gut-brain signaling pathways, though the evidence is mixed and the effect sizes at typical dietary exposure levels are debated. For most people consuming zero-sugar products in moderate quantities, the primary concern is whether the product is genuinely nutritionally improved without the sugar or whether other problematic ingredients remain despite the sugar reduction. A zero-sugar energy bar that replaces sugar with sucralose but still contains refined white flour and industrial oils is not a nutritional improvement — just a different set of compromises.
Organic Certification: What It Means for Nutrition
USDA organic certification guarantees that a food was produced without synthetic pesticides, synthetic fertilizers, antibiotics, growth hormones, or genetic engineering. It does not guarantee superior nutritional content. Research comparing organic and conventional foods shows modest differences in some antioxidant and omega-3 content in favor of organic produce and dairy, but these differences are not large enough to constitute a primary nutritional intervention. The meaningful benefit of organic for health-conscious consumers is primarily reduced pesticide residue exposure — a legitimate concern for the “dirty dozen” crops with the highest conventional pesticide loads. For processed organic products — organic cookies, organic chips, organic cereals — the organic certification applies to ingredients but does not change the fundamental nutritional profile. An organic sugar cookie is nutritionally equivalent to a conventional sugar cookie.
Label Reading for Specific Fitness Goals: A Quick Reference
Different fitness goals create different label reading priorities. For muscle building, the primary metrics are: protein grams per serving (and per 100 calories, which normalizes for energy density), protein source quality from the ingredients list (animal proteins and soy over collagen and plant protein blends), and caloric density relative to volume and satiety. For fat loss, the most relevant metrics are: caloric density (calories per gram of food, where lower is better for volume eating strategies), fiber content (higher fiber supports satiety and gut health), added sugars (minimize), and protein content (higher protein supports muscle preservation and satiety during caloric restriction). For endurance performance, carbohydrate type and timing implications dominate: are carbohydrate sources appropriate for the intended consumption timing relative to training? Is the fiber content compatible with consumption close to exercise?
For general health maintenance without specific body composition goals, the most important label metrics shift toward micronutrient density, fiber content, sodium management, and minimizing ultra-processed ingredient profiles — concerns that are less acute for the performance-focused athlete but increasingly important for long-term health outcomes as training intensity decreases across the lifespan. Developing label reading skills that serve your current primary goal while maintaining awareness of the broader nutritional picture prepares you to adapt your label literacy as your goals evolve.
Building Long-Term Label Reading Habits: Making It Automatic
The most powerful outcome of systematic label reading practice is the development of automatic pattern recognition that operates quickly and accurately without conscious deliberate effort. Reaching this level requires consistent practice over months — actively reading labels on new products, comparing alternatives, and building a mental library of the nutritional profiles of commonly purchased items. The mental library effect is significant: once you know the protein content, fiber content, and ingredient quality of the products you buy regularly, re-reading those labels at each purchase becomes unnecessary, and your cognitive resources are freed for evaluating new products and making more nuanced comparative assessments.
The habit is most effectively built by making label reading a non-negotiable part of grocery shopping for a defined 8–12 week period — committing to reading the nutrition facts panel and ingredients list of every new product before placing it in the cart, regardless of time pressure or prior assumptions about the product. This disciplined practice builds the pattern recognition and mental food database that makes label literacy effortless over time. Athletes who complete this kind of deliberate practice period consistently report that it transforms their relationship with food purchasing — they feel more informed, less susceptible to marketing manipulation, and more confident that their dietary choices actually align with their stated nutritional goals.

Applying Nutrition Label Knowledge to Real Shopping Decisions
The knowledge in this article is only useful if it translates into better food choices made efficiently in real shopping conditions. Food shopping involves time pressure, competing considerations, marketing influences, and the cognitive load of dozens of simultaneous food evaluation decisions. The following framework makes nutrition label reading fast and systematic — a skill that improves with practice until it becomes nearly automatic.
The 10-Second Label Evaluation Protocol
For any packaged food, a systematic 10-second evaluation covers the most important information: First (2 seconds), check serving size and whether you will actually consume one serving or more. Second (3 seconds), scan the nutrition facts panel for: calories per serving (appropriate for your needs?), protein grams (adequate if this is a protein source?), added sugars (under 5g per serving for non-dessert foods?), and sodium (under 15–20% DV per serving for savory foods consumed multiple times daily?). Third (5 seconds), skim the first 3–5 ingredients on the ingredients list — these account for the majority of the product’s weight. Are they whole food ingredients you recognize? If the first few ingredients are refined flour, sugar, and industrial oils, the nutrition facts panel is essentially irrelevant — this is not a food that supports health goals regardless of its specific numbers.
This 10-second protocol doesn’t provide comprehensive nutritional analysis — it identifies red flags and confirms quality in the time actually available during shopping. For products that pass the initial screen, a more detailed evaluation can happen at home without time pressure. The protocol prevents the most common label-reading errors: being deceived by front-of-package marketing without checking the label, focusing exclusively on one nutrient (like calories or fat) while ignoring ingredients quality, and being confused by unfamiliar serving sizes.
Comparing Two Similar Products: A Decision Framework
When comparing two similar products — two brands of protein bars, two varieties of bread, two options for pre-workout carbohydrates — use a standardized comparison to ensure consistency. Adjust all values to the same serving size before comparing: if Product A has a 30g serving and Product B has a 40g serving, multiply Product A’s values by 1.33 to normalize to a 40g comparison. Then evaluate: protein per 100g (or per normalized serving), fiber content, added sugars, sodium, and ingredient quality. The product with higher protein, more fiber, less added sugar, and a shorter ingredients list of recognizable whole food components is the better nutritional choice in most body composition and performance contexts, assuming similar palatability and price.
Building a Label Reading Practice That Improves Over Time
Label reading is a skill that compounds with practice. The first few weeks of systematic label reading are slow and sometimes frustrating — there is a lot to process simultaneously. Over time, pattern recognition develops: you begin to quickly identify the specific red flags (sugar as one of the first three ingredients, partially hydrogenated oils, excessive sodium) and the quality indicators (short ingredients lists, recognizable whole food components, high fiber, adequate protein) without conscious deliberate analysis. Athletes who practice systematic label reading for 2–3 months report that it becomes nearly automatic — they can evaluate most products in seconds rather than minutes and have developed a reliable personal database of which products in their regular shopping environment actually deliver what their marketing claims.
Using Digital Tools to Extend Label Reading
Several digital tools extend the label reading capability beyond the physical label. MyFitnessPal, Cronometer, and similar nutrition tracking apps allow you to log foods from barcode scans that retrieve the full nutritional database for a product, enabling precise macro and micronutrient tracking beyond what the label’s mandatory disclosures cover. The USDA FoodData Central database provides comprehensive nutritional data for thousands of foods and food products, including nutrients not disclosed on standard labels. Open Food Facts is a crowd-sourced database particularly strong on additive and processing level information that goes beyond standard label data. Using these tools for detailed analysis of your regularly consumed products builds a deep understanding of your actual nutritional intake that neither labels nor general nutritional guidelines alone can provide.
Frequently Asked Questions About Nutrition Labels
Do I need to read every label every time I shop? Only for new or unfamiliar products. Once you’ve evaluated the products you buy regularly and know their nutritional profile, you don’t need to re-read them each time. The investment is front-loaded: systematic label evaluation when adding new products to your regular buying pattern, with minimal ongoing effort for established purchases.
Are expensive health food products worth it based on their labels? Often not. Premium health food positioning frequently commands a 2–3x price premium over conventional alternatives without delivering proportionally superior nutritional content. Evaluate premium products by the same objective label criteria as conventional ones — if the nutrition facts panel and ingredients list of a premium product aren’t meaningfully better than a well-chosen conventional alternative, the premium is paying for marketing and positioning rather than nutrition.
What should I do if a product’s label is confusing or contradictory? The ingredients list always takes precedence over front-of-package claims in any apparent contradiction. If a product claims “no added sugar” but lists honey, fruit juice concentrate, or agave as ingredients, those are added sugars despite the claim. The regulatory definition of “added sugar” has specific boundaries, and some sweeteners fall in regulatory gray areas — the ingredients list reveals what’s actually present regardless of how the front of the package characterizes it.
How important is the order of amino acids on a protein supplement label? Protein supplements are required to disclose total protein per serving, but amino acid profiles are only disclosed voluntarily. Look for products that publish a full amino acid panel — particularly leucine content, which is the primary trigger for muscle protein synthesis. A whey protein concentrate typically provides 8–10g of leucine per 25g protein serving; a collagen supplement provides less than 1g. This difference is not visible on the standard nutrition label but is available from manufacturers who publish full amino acid profiles.
Building a Smart Grocery List Using Label Knowledge
Translating label literacy into systematic grocery list construction is the practical bridge between knowing how to read labels and consistently eating in alignment with nutritional goals. A label-informed grocery list is organized not just by category but by specific quality criteria: for protein sources, the list specifies lean animal proteins and complete plant proteins rather than just “protein foods”; for carbohydrate sources, it distinguishes between the pre-workout carbohydrate staples (white rice, oats, potatoes) and the general diet whole grain sources (brown rice, whole grain bread, legumes); for fat sources, it specifies olive oil, avocado, and nuts rather than just “healthy fats.” This specificity makes shopping decisions automatic because the judgment has already been made during list construction rather than at the shelf under time pressure and marketing influence.
A practical approach is to build a master grocery template — a standing list of the specific products you’ve evaluated and confirmed meet your nutritional standards — and use this template as the default starting point for each week’s shopping. Deviations from the template (new products, seasonal items, convenience substitutions) require label evaluation; template items do not. This approach concentrates the cognitive work of label reading into a one-time evaluation per product rather than repeating it at every purchase, dramatically reducing the total time required to maintain high nutritional standards across weeks and months of consistent shopping.
For athletes navigating different stores (grocery, warehouse clubs, specialty health food stores, online), building store-specific knowledge of which products at each location meet your nutritional standards makes cross-store shopping efficient. Warehouse clubs often provide excellent value on high-quality proteins, nuts, and bulk grains; specialty health food stores offer the most diversity of novel and specialized products worth evaluating; conventional grocery chains are most practical for regular weekly staples. Knowing the best products at each location eliminates the need to evaluate new options at every shopping trip and makes maintaining nutritional standards convenient even in time-limited shopping conditions.
Label Reading for Food Allergies and Dietary Restrictions
Beyond nutritional quality, labels provide critical safety information for people with food allergies or dietary restrictions. The FDA requires disclosure of the nine major food allergens: milk, eggs, fish, shellfish, tree nuts, peanuts, wheat, soybeans, and (added in 2023) sesame. These disclosures appear either within the ingredients list or in a separate “Contains:” statement below it. For athletes with specific dietary restrictions — celiac disease requiring gluten avoidance, dairy allergy or intolerance, nut allergies — the “Contains:” statement and the ingredients list are the primary safety verification tools, not the front-of-package “gluten-free” or “dairy-free” claims, which are regulated but not foolproof. Cross-contamination warnings (“may contain traces of…”) are voluntary disclosures that manufacturers include when shared production equipment creates contamination risk — highly sensitive individuals should treat these warnings as cautionary, while less sensitive individuals may evaluate them in the context of their individual threshold.
For athletes following specific dietary patterns — vegan, vegetarian, halal, kosher — the ingredients list provides the verification tool for dietary compliance. Vegan athletes check for any animal-derived ingredients (gelatin, carmine, casein, lactose, whey, honey, beeswax, lanolin). Halal and kosher compliance involves both ingredient review and certification seal verification. Athletes with religious dietary requirements are often the most skilled label readers because the stakes of misreading a label are higher than nutritional consequences alone — their practice builds the systematic thoroughness that produces genuine label literacy. The comprehensive checking habit developed for compliance reasons transfers directly to the nutritional quality assessment skills that all athletes benefit from developing.
The Bigger Picture: Labels as One Tool in a Complete Nutritional Framework
Nutrition label literacy is powerful — but it is most powerful when integrated into a complete nutritional framework rather than used in isolation. Labels answer the quantitative question of what a packaged food contains. They say nothing about the quality of your overall dietary pattern, the adequacy of your total energy and macronutrient intake for your training demands, or the behavioral and psychological dimensions of eating that ultimately determine whether good nutritional intentions are consistently executed. Athletes who develop strong label reading skills and use them within a framework of overall dietary adequacy — sufficient total calories, adequate protein distribution, appropriate carbohydrate timing, and micronutrient diversity from whole foods — experience the full compound benefit of informed nutritional decision-making.
The most sophisticated application of label literacy is not optimizing individual products in isolation but using label information to construct and maintain an overall dietary pattern that is simultaneously high-quality, practical, affordable, and enjoyable enough to sustain indefinitely. A dietary pattern built on predominantly whole foods with minimal processing — where most food choices don’t require label reading because they are single-ingredient whole foods — supplemented by carefully selected packaged products evaluated through the systematic label reading skills in this article, represents the practical nutritional ideal for most athletes. The skills in this guide make the packaged food selection component of that pattern informed and reliable, complementing the whole-food foundation that represents the core of any genuinely health-supporting diet.