The Best Way to Measure Your Body Fat at Home

1. Why Measuring Body Fat Matters More Than Scale Weight
The bathroom scale is the most widely used fitness tracking tool in the world — and one of the most misleading. Body weight, measured in isolation, is a composite of muscle, fat, bone, water, organ mass, food volume, and glycogen — a measurement that conflates all of these physiologically distinct components into a single number that tells the observer almost nothing about the specific variable that most athletes actually care about: how much of their body is fat versus how much is metabolically active lean tissue. I spent 18 months of training monitoring only scale weight, interpreting every pound gained as fat and every pound lost as progress — unaware that the muscle I was building was offsetting fat loss on the scale, making my actual body composition improvement invisible to the metric I was using. Understanding body fat percentage — the fraction of total body weight that is fat mass — provides the body composition insight that scale weight cannot, and this article provides the complete guide to measuring it at home with the accuracy that meaningful tracking requires.
The Scale Weight Problem: Why One Number Isn’t Enough
Body weight fluctuates by 1–3kg within a single day — driven by food and beverage consumption, hydration status, glycogen storage, bowel content, and hormonal water retention cycles in women. The daily scale weight reading captures all of these fluctuations simultaneously, producing the day-to-day variation that discourages, confuses, and misleads athletes who interpret each reading as meaningful signal rather than the noise-contaminated measurement it actually represents. Consider the 7-day weight sequence that a successful athlete might experience during a fat loss phase: Monday 82.0kg, Tuesday 82.8kg, Wednesday 81.5kg, Thursday 83.1kg, Friday 81.9kg, Saturday 82.4kg, Sunday 81.7kg. The daily readings vary by 1.6kg — suggesting to an inexperienced athlete that training and diet are producing inconsistent, chaotic results. The 7-day average: 82.2kg. The previous week’s 7-day average: 82.8kg. The trend: 0.6kg of genuine fat loss in one week — exactly on target for a well-designed fat loss phase. The problem is that most athletes read the daily number rather than the weekly trend, and the daily variation overwhelms the genuine progress signal. Body fat percentage measurement addresses this problem by providing a metric that is less sensitive to the short-term hydration and glycogen fluctuations that drive daily weight variation — a monthly body fat percentage assessment provides cleaner signal about actual fat mass change than daily weighing despite the lower measurement frequency.
Muscle Gain and Fat Loss Happening Simultaneously: What the Scale Misses
The body recomposition process — building muscle while losing fat simultaneously — is particularly invisible to scale weight measurement. An athlete who gains 2kg of muscle and loses 2kg of fat over 12 weeks has achieved a dramatic body composition transformation: smaller, more compact, more defined, stronger, and healthier than before. The scale reading: unchanged at the start and end weight. Without body fat percentage measurement, this athlete has no objective evidence that 12 weeks of training and dietary discipline produced any physiological change — despite achieving exactly the body composition outcome that the training and diet were designed to produce. Body fat percentage would correctly reveal the change: if this athlete began at 85kg with 25% body fat (21.25kg of fat) and ended at 85kg with 22.6% body fat (19.2kg of fat, having lost 2kg of fat and gained 2kg of muscle), the body fat percentage decreased from 25% to 22.6% — a meaningful, objectively documented composition improvement that validates the 12-week investment. Research from the Journal of Strength and Conditioning Research on body composition assessment consistently identifies the use of body weight alone as an inadequate measure of training and dietary effectiveness — recommending the combination of body weight, body fat percentage, and lean mass tracking as the minimum assessment battery for athletes pursuing body composition change. The additional time investment of a monthly body fat measurement (5–10 minutes for the methods described in this article) converts the body composition tracking from an incomplete, potentially misleading picture into an accurate, motivating record of genuine progress.
Body Fat Percentage vs. Body Mass Index: The Clinical Picture
Body mass index (BMI) — the ratio of body weight to height squared — is the most widely used clinical body composition screening tool, despite its well-documented limitations for individuals with above-average muscularity. The BMI limitation is simple and significant: BMI treats all body weight identically, regardless of whether it is fat or muscle. A 180cm, 90kg competitive powerlifter with 12% body fat (10.8kg of fat, 79.2kg of lean mass) has a BMI of 27.8 — classified as “overweight.” A 180cm, 78kg sedentary individual with 28% body fat (21.8kg of fat, 56.2kg of lean mass) has a BMI of 24.1 — classified as “normal weight.” The BMI correctly identifies the first athlete as heavier but completely inverts the health picture — the powerlifter is objectively healthier, leaner, stronger, and at lower risk for the metabolic diseases associated with excess fat mass than the sedentary individual, despite their “overweight” BMI classification. Body fat percentage measurement corrects this misclassification by measuring the relevant variable directly — the fraction of body weight that is fat. The clinical significance for athletes: athletic individuals should use body fat percentage rather than BMI as their primary body composition metric, and should educate healthcare providers on the BMI limitations when being assessed in clinical contexts where BMI would be misinterpreted as an accurate health indicator.
What Body Fat Percentage Tells You About Health and Performance
Body fat percentage is not only a cosmetic metric — it is a clinically meaningful indicator of metabolic health, hormonal function, athletic performance, and disease risk that provides direct information about these health dimensions that scale weight and BMI cannot. Metabolic health: visceral fat (the fat stored around the abdominal organs, not directly measurable by most home methods but correlated with total body fat and particularly with waist circumference) is the metabolically active fat tissue that produces the inflammatory cytokines, free fatty acids, and adipokines that drive insulin resistance, systemic inflammation, dyslipidemia, and the cardiovascular risk factors associated with obesity. As total body fat percentage decreases — through the fat loss methods supported by the nutritional and training practices in this article — visceral fat decreases proportionally, reducing the inflammatory and metabolic risk profile that high body fat represents. Hormonal function: body fat percentage affects the production and metabolism of testosterone, estrogen, and cortisol. In men, very low body fat (below 5%) is associated with reduced testosterone and increased cortisol that impair recovery, libido, and mood; moderate body fat (10–20%) maintains the hormonal milieu that supports athletic performance. In women, very low body fat (below 16–18%) can disrupt the hypothalamic-pituitary-ovarian axis, reducing estrogen and producing the menstrual irregularities and stress fracture risk that the female athlete triad describes. Athletic performance: the power-to-weight ratio that determines performance in weight-relative sports (running, climbing, gymnastics, combat sports) is directly influenced by body fat percentage — reducing excess fat mass while maintaining or increasing lean mass improves power-to-weight ratio without the muscle loss that total weight reduction through caloric restriction alone produces. These performance, health, and hormonal implications make body fat percentage measurement a clinically and practically valuable tool for athletes beyond its use as a body composition progress metric.
Setting Realistic Body Fat Goals
Realistic body fat percentage goals — informed by the evidence on healthy ranges, athletic performance norms, and the physiological costs of extremely low body fat — are the prerequisite to using body fat measurement productively rather than as a metric that drives unhealthy restriction. The evidence-based healthy body fat ranges for active adults: for men, 10–20% is the athletic-to-fitness range where the combination of good health, hormonal function, and visible muscle definition that most athletes target is achievable; above 25% in men is associated with increasing metabolic health risk; below 8% in men is associated with the hormonal and recovery impairments that interfere with health and performance. For women, 18–28% is the athletic-to-fitness range for healthy active women; above 32% in women is associated with increasing metabolic health risk; below 16% in women is associated with the hormonal disruption risk of the female athlete triad. The elite athlete ranges (4–8% for male elite endurance athletes; 14–20% for female elite athletes) represent the performance-optimized end of the spectrum — achievable and appropriate for competitive athletes during their competitive season, but not sustainable year-round and not appropriate as a baseline goal for recreational athletes. Setting the body fat goal at the lower end of the healthy range — approximately 12% for active men, 20% for active women — provides a realistic, health-supporting target that most athletes can achieve and maintain through consistent training and dietary practice without the extreme restriction that competition-level leanness requires.
The Relationship Between Body Fat and Athletic Performance
The body fat-performance relationship is not linear across the full range — there is a performance-optimizing body fat range that differs by sport, and both too much and too little fat impair specific performance dimensions. Excess fat reduces performance in: weight-supported activities (running, gymnastics, bodyweight sports) where additional mass requires more energy to move; power-to-weight dependent sports (cycling, combat sports, distance running) where fat mass without force production capability reduces the power output per kilogram that competitive performance requires; and heat-dissipation-demanding activities where the insulating effect of subcutaneous fat impairs the thermoregulation that intense exercise requires. Insufficient fat impairs performance in: cold-water endurance events where subcutaneous fat provides insulation; extreme endurance events (multiday ultramarathon, Tour de France stages) where fat serves as the primary fuel source for low-intensity sustained effort; and contact sports where some fat provides impact cushioning for the repeated collisions that the sport involves. The practical performance implication: for most recreational athletes pursuing general fitness and body composition improvement, reducing body fat toward the lower end of the healthy range produces performance improvements without the risks of extreme leanness — and body fat percentage measurement provides the objective feedback that confirms the fat reduction is occurring as intended and that the healthy range floor is not being approached inappropriately.
The Psychological Impact of Body Composition Tracking
How athletes relate to body composition measurement — whether it serves as a motivating progress tracker or a source of anxiety and obsession — depends significantly on the measurement approach and the psychological framework applied to the data. The healthy tracking mindset: body fat percentage is one data point among many (alongside training performance, energy levels, sleep quality, and subjective wellbeing) that informs training and dietary decisions — not a judgment of worth or a source of shame when it moves in the undesired direction. Athletes who maintain this data-informed perspective consistently use body composition measurement as a productive tool that guides rational adjustments; those who attach identity and self-worth to the number experience the measurement anxiety and dysfunctional restriction that body composition tracking sometimes drives. Warning signs of unhealthy tracking: measuring more than weekly; allowing measurements to determine mood or self-assessment; making dramatic dietary or training changes in response to single measurements (rather than trends); and persistently pursuing body fat percentages below the healthy range despite health and performance consequences. If body fat percentage tracking produces these patterns, temporarily suspending measurement while focusing on performance-based goals (strength improvements, endurance benchmarks, skill development) and intuitive eating is the appropriate response — body composition tracking is a tool that should serve the athlete, and when it begins producing more psychological harm than informational benefit, pausing the tool is the rational decision. The measurement frequency recommendation for most athletes: monthly assessment for body fat percentage provides sufficient trend data to guide training and dietary decisions without the frequency that enables the obsessive comparison and anxiety that daily or weekly measurement can produce.
Combining Multiple Metrics for Complete Body Composition Insight
No single measurement fully captures the body composition picture — the combination of multiple simple metrics provides the comprehensive assessment that any single metric cannot. The recommended home body composition assessment battery: scale weight (daily, averaged weekly — provides the total weight trend); waist circumference at the navel (monthly — the single best predictor of visceral fat that home measurement provides, with waist-to-height ratio above 0.5 associated with increasing metabolic risk); body fat percentage by a consistent method (monthly — provides the fat-versus-lean breakdown that weight alone cannot); and progress photos in consistent lighting, pose, and time of day (monthly — provides the visual body composition documentation that objective measurements capture numerically but cannot convey aesthetically). The combination of these four metrics provides more complete body composition insight than any single measure and allows the meaningful interpretation of changes that a single metric might obscure. For example: weight unchanged, waist circumference decreased 2cm, body fat percentage decreased 1%, progress photos show visible definition improvement — a clear recomposition success that scale weight alone would have reported as “no change.” The four-metric battery requires under 10 minutes per monthly assessment and provides the comprehensive data that converts body composition tracking from an occasional frustration into a reliable, motivating progress documentation system.
Body Composition for Different Training Goals
The body composition targets and measurement priorities differ across training goals — and aligning the measurement approach with the specific goal prevents the metric confusion that applying fat loss metrics to a muscle building phase (or vice versa) produces. Fat loss phase: the primary metric is body fat percentage reduction, with scale weight tracked as a secondary metric and lean mass preservation confirmed through strength maintenance. The fat loss phase is successful when body fat percentage decreases consistently (0.5–1% per month is realistic and sustainable) while strength performance is maintained or minimally decreased. Muscle building phase: the primary metric is lean mass increase, tracked through strength performance improvements and, secondarily, through body fat percentage stability or modest increase (a small fat gain during a building phase is normal and acceptable if lean mass is growing simultaneously). The building phase is successful when scale weight increases alongside strength improvements and body fat percentage remains below the target ceiling for the individual. Maintenance phase: the primary objective is stability — maintaining body fat percentage within a target range (typically the lower end of the healthy range achieved during the fat loss phase) while continuing to train and eat for performance and health. Monthly measurements confirm that the maintenance approach is working — and early detection of gradual creep (body fat increasing 0.5% per month for several consecutive months) allows dietary adjustment before significant fat regain has accumulated. Aligning the measurement focus with the current training phase — fat in fat loss, lean mass in building, stability in maintenance — ensures the metrics are providing relevant feedback rather than the frustration of applying the wrong measure to the current objective.
Why Athletes Underestimate Their Body Fat Percentage
A consistent finding in body composition research is that athletes who estimate their own body fat percentage without measurement systematically underestimate it — typically by 3–8 percentage points. The sources of this underestimation: the visual comparison bias (comparing to extremely lean athletes in media, fitness apps, and social media creates a distorted reference point that makes personal leanness appear greater than it is); the muscle-fat visual confusion (well-developed muscle in a region obscures the overlying fat, making muscular individuals appear leaner than body fat percentage would indicate); and the clothing and posture effects that everyday appearance provides (strategic clothing choices and posture adjustments in normal life consistently obscure fat distribution in ways that the athletic assessment position does not). The practical consequence of underestimation: athletes who believe they are at 15% body fat when measurement reveals 22% are operating with an inaccurate body composition map that leads to inappropriate dietary decisions, unrealistic competitive expectations, and the surprise and frustration of discovering that the body composition achievement they assumed they had already reached requires substantially more work than their self-assessment suggested. Accurate measurement — performed with the methods described in the next section — corrects this systematic bias and provides the accurate starting point from which meaningful goal-setting and progress tracking can proceed. The measurement discomfort of discovering a higher-than-expected body fat percentage is transient; the benefits of operating with accurate body composition data persist throughout the training career.
The History of Body Composition Science: From Underwater Weighing to Modern Methods
Understanding how body composition measurement developed from research laboratory procedures to accessible home tools provides context for the accuracy expectations that different methods produce. The gold standard body composition assessment: DEXA (dual-energy X-ray absorptiometry) scanning distinguishes fat mass, lean mass, and bone mineral density by measuring the differential attenuation of two X-ray beams through different tissue types — producing a comprehensive, highly accurate body composition map with 1–2% margin of error. DEXA requires specialized equipment costing $100,000+ and a trained operator, limiting its accessibility to clinical and research settings. The research reference method: hydrostatic (underwater) weighing applies the Archimedes principle to body composition — the body’s density is calculated from the ratio of scale weight to underwater weight (adjusted for residual lung volume), and fat percentage is derived from the density difference between fat tissue (density 0.9 g/cm³) and lean tissue (density 1.1 g/cm³). Hydrostatic weighing accuracy approaches DEXA but requires specialized tank equipment and is now largely replaced by air displacement plethysmography (the Bod Pod) in research settings. The home measurement methods available to athletes — skinfold calipers, bioelectrical impedance, tape measure calculations, and visual estimation — represent the practical accessibility end of the accuracy spectrum. Understanding where each method falls on the accuracy-versus-accessibility tradeoff allows appropriate selection for the individual’s measurement goals and the interpretation framework that the inherent limitations of each method require. From ACSM body composition assessment guidelines, the recommendation for field-based assessment (outside clinical settings) is consistent measurement with the same method over time — because the tracking of change within a method is more meaningful than the absolute value that cross-method comparisons provide.
Making the Decision to Start Measuring
The decision to begin systematic body composition tracking — rather than relying on scale weight or visual impression alone — is one of the highest-return fitness investments available to athletes pursuing body composition change. The information that body fat percentage measurement provides converts vague body composition goals (“I want to get leaner”) into specific, measurable targets (“I want to reduce body fat from 24% to 18% over 6 months”) that allow rational planning, progress verification, and the motivating documentation of genuine progress that subjective impression cannot reliably provide. The barrier to starting is typically the unfamiliarity with the methods rather than the cost or time involved — the most accessible home methods (tape measure calculations, bioelectrical impedance scales) require under 5 minutes and minimal cost, making the decision to start straightforward once the methods are understood. The next section describes all six practical home measurement methods in complete detail — providing everything needed to select the most appropriate method, perform the measurement correctly, and interpret the result accurately. Understanding which foods are satiating and how to eat for fat loss is necessary; knowing whether the fat loss is actually occurring at the intended rate — through accurate body composition measurement — is what converts the nutritional strategy into the documented, motivating, reality-confirmed progress that sustains the effort required to reach meaningful body composition transformation.
Body composition tracking is ultimately an act of respect for the training and dietary effort being invested — providing the honest, objective feedback that confirms the strategy is working as intended, identifies when adjustments are needed, and documents the genuine transformation that weeks and months of consistent effort produce. Athletes who track consistently report both better outcomes and higher training motivation than those who train without objective body composition feedback — because the measurement converts the subjective, uncertain experience of body change into the concrete, documented progress that sustains long-term commitment. Begin the measurement process this week — choose the method that fits your budget and access, take the baseline measurement, and commit to the monthly assessment schedule that converts body composition tracking from an occasional frustration into the reliable progress documentation system that it is designed to be. The consistency of measurement approach — same time of day, same hydration status, same clothing, same conditions — is as important as the method choice itself, because the reproducibility that consistent conditions provide is what converts the body fat number from a single snapshot into the meaningful trend that body composition tracking requires. The investment in understanding measurement correctly, as described in this article, is the investment that makes all subsequent measurements genuinely informative rather than the inconsistent, unreproducible readings that improper technique produces. The investment in body fat measurement knowledge pays dividends across every subsequent phase of athletic development. Start today, measure monthly, and let the data guide you forward with confidence and clarity. Use this knowledge to train smarter, eat better, and track what truly matters for lasting athletic progress.
2. The 6 Methods to Measure Body Fat at Home: Accuracy, Cost, and How-To
Six body fat measurement methods are accessible to home users — ranging from the tape measure and a formula (free) to consumer bioelectrical impedance devices ($30–200) to skinfold calipers ($10–50). Each method has specific accuracy limitations, ideal use conditions, and practical procedures. Understanding all six allows the selection of the method best matched to individual budget, consistency requirements, and acceptable margin of error.
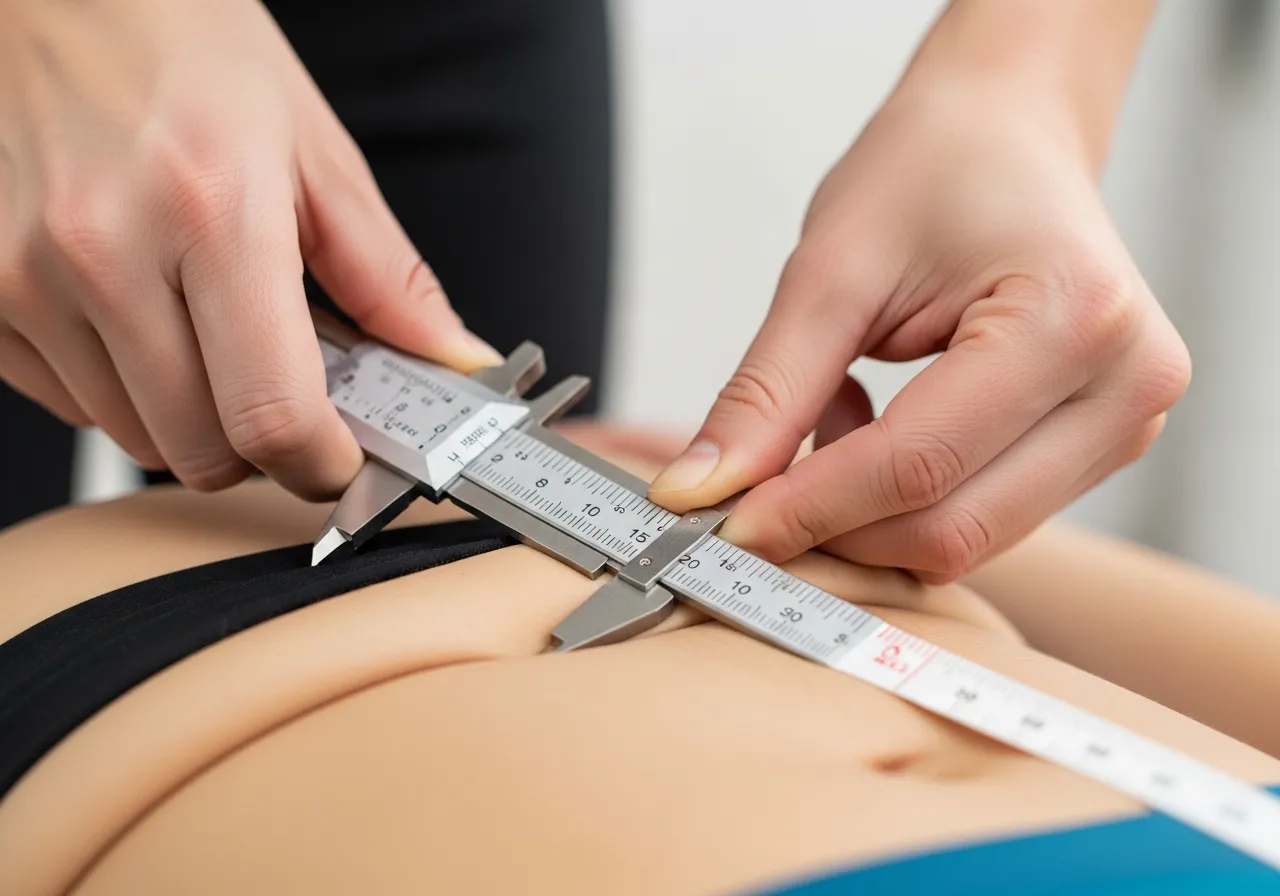
Method 1: Skinfold Calipers
Skinfold calipers measure the thickness of subcutaneous fat at standardized body sites — the fat pinched between the jaws of the caliper at each site is measured in millimeters, and the sum of sites is entered into a validated prediction equation that estimates total body fat percentage. The 3-site Jackson-Pollock protocol (chest, abdomen, thigh for men; tricep, suprailiac, thigh for women) is the most practical home caliper protocol — requiring only three measurements and producing estimates within 3–4% of DEXA in skilled hands. Technique: pinch the skin firmly between thumb and index finger, apply the caliper 1cm below the pinch, wait 2 seconds for the dial to stabilize, record the reading. Take each site three times and average. Measure at the same time of day (morning, pre-exercise) for consistency. Accuracy improves dramatically with practice — the first few measurements have higher error than measurements taken after 10–15 practice sessions. Cost: $10–50 for plastic or metal calipers. The Accu-Measure single-site caliper (suprailiac only, $20) provides a simplified single-measurement protocol appropriate for tracking trends even if absolute accuracy is limited.
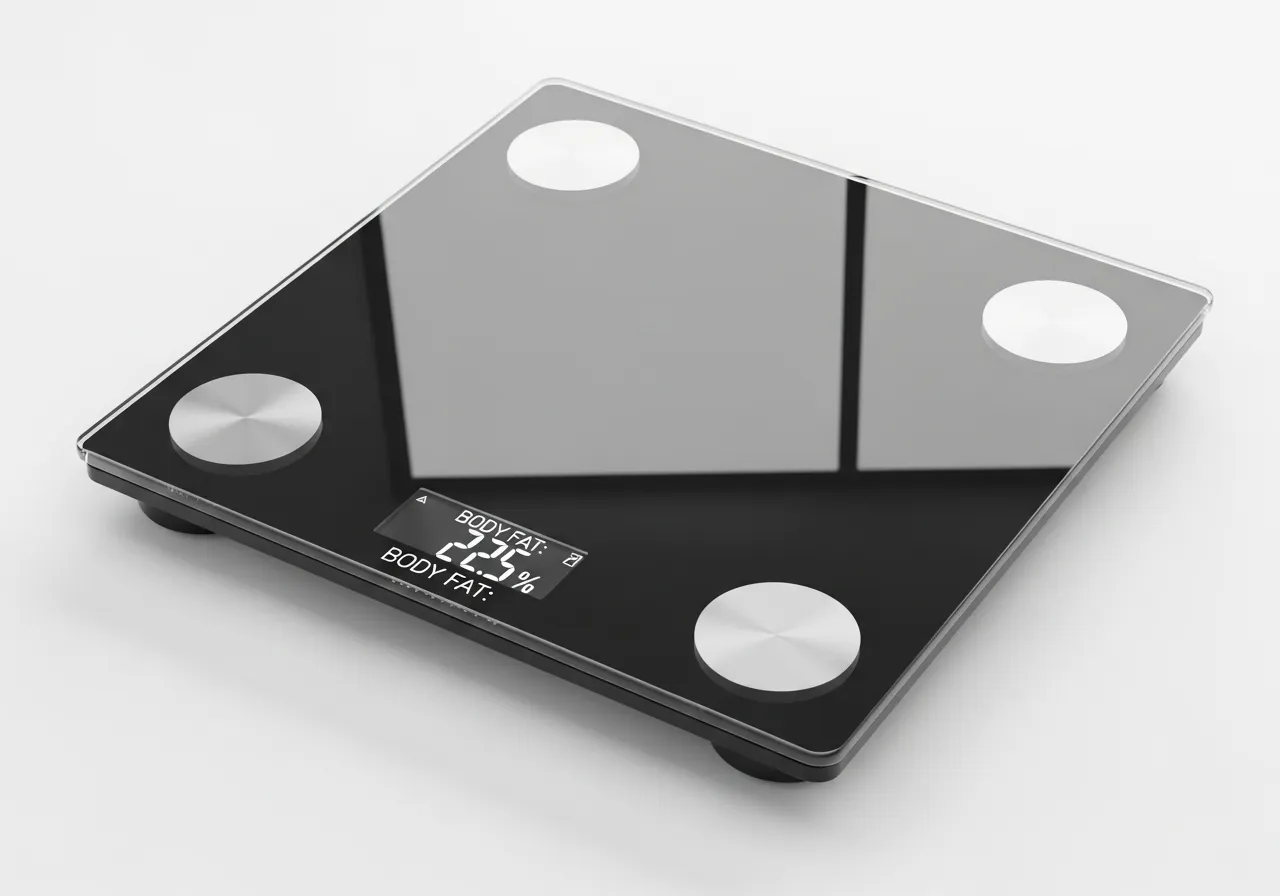
Method 2: Bioelectrical Impedance Analysis (BIA) Scales
BIA scales send a low electrical current through the body and estimate body fat percentage from the resistance the tissue provides — fat conducts electricity poorly, lean tissue conducts it well. Consumer BIA devices (bathroom scales with foot electrodes, or handheld devices) are the most convenient home measurement method, producing a body fat reading in under 30 seconds. The significant limitation: BIA accuracy is highly sensitive to hydration status — dehydration reduces the electrical conductance of lean tissue, causing BIA to overestimate body fat; hyperhydration does the opposite. Testing conditions that minimize hydration-driven error: measure in the morning after voiding, before eating or drinking, after avoiding intense exercise for 12 hours and alcohol for 24 hours. Under these standardized conditions, consumer BIA devices produce estimates within 3–5% of DEXA — sufficient for trend tracking if measured consistently under the same conditions. Cost: $30–150 for consumer BIA scales. Higher-end devices (Withings Body+ or Tanita models, $80–150) provide smartphone connectivity and trend tracking that improves the longitudinal monitoring value. From PubMed body composition accuracy research, BIA is best used for trend monitoring rather than absolute body fat percentage — the consistency of the measurement conditions matters more than the device quality for reliable tracking.
Methods 3–6: Tape Measure, Photos, Navy Formula, and DEXA
The US Navy circumference formula uses waist, neck, and hip (women only) measurements to estimate body fat percentage — providing a free, equipment-only method with accuracy within 3–4% in populations similar to the military samples the formula was validated on. Measure: neck at the narrowest point; waist at the narrowest point (men) or at the navel (women); hips at the widest point (women). Enter measurements into the online Navy Body Fat Calculator. Consistency tip: measure at the same time of day, same tightness, same body position. Progress photos — taken monthly under identical lighting, angle, time of day, and clothing — provide the visual body composition record that numerical measurements cannot fully capture. A side-by-side monthly photo comparison reveals muscle definition changes, fat distribution shifts, and overall body shape evolution that numbers alone miss. DEXA (dual-energy X-ray absorptiometry) scan — the gold standard body composition assessment, available at sports medicine clinics, university research facilities, and some commercial fitness centers for $50–150 per scan — provides the most accurate body fat, lean mass, and bone density measurement available outside a research laboratory. A quarterly DEXA scan alongside monthly home measurements calibrates the home methods against the gold standard — identifying the personal correction factor that converts the home measurement reading into the most accurate possible absolute estimate.
Ultimately, the best body fat measurement method is the one you will actually use consistently every month — prioritize measurement habit over measurement perfection, and allow the consistent trend data to guide the body composition journey with the objectivity that subjective assessment cannot provide.
3. Understanding Your Results: Body Fat Ranges, Categories, and What They Mean
A body fat percentage number without context is meaningless — knowing you are at 22% body fat is only actionable when you understand where 22% sits within the ranges for your sex, age, and athletic goals. This section provides the complete reference framework for interpreting body fat measurements.
Body Fat Categories for Men and Women
The American College of Sports Medicine body fat classification for men: essential fat 2–5% (the minimum fat required for physiological function — organ cushioning, hormonal production, cell membrane integrity); athlete range 6–13% (visible muscle definition, competitive leanness achievable by dedicated athletes); fitness range 14–17% (good muscle definition, healthy metabolic profile, sustainable year-round for active individuals); acceptable range 18–24% (average for active adult men, no significant health risk); overweight 25–31%; obese 32%+. For women: essential fat 10–13%; athlete range 14–20%; fitness range 21–24%; acceptable range 25–31%; overweight 32–38%; obese 39%+. The higher essential fat percentage in women reflects the sex-specific fat deposits (breasts, hips, pelvis) that reproductive function requires — and explains why the healthy body fat ranges for women are approximately 8–10% higher than for men at each category. Age-related adjustment: body fat percentage naturally increases with age as muscle mass decreases (sarcopenia) and fat mass redistributes — a 50-year-old woman at 28% body fat is in a similar health position to a 25-year-old at 24%, because the age-related lean mass loss that produces higher fat percentage at the same body weight is a distinct physiological process from diet-driven fat accumulation. From ACSM body composition guidelines, athletes should interpret their body fat percentage within their age- and sex-specific reference ranges rather than comparing directly to population-average ranges that do not account for the muscle mass that training develops.
What Your Body Fat Number Means for Training and Nutrition
The body fat measurement provides specific actionable guidance for training and nutrition strategy — not just a progress report but a decision tool. Athletes above 25% (men) or 32% (women) benefit from prioritizing fat loss through caloric deficit and resistance training to establish the metabolic health foundation that supports high-intensity training; the excess visceral fat at these levels impairs insulin sensitivity, recovery capacity, and cardiovascular function in ways that directly limit training performance. Athletes in the fitness range (14–17% men, 21–24% women) have the body composition that supports high-quality training across all modalities — the hormonal milieu, insulin sensitivity, and cardiovascular function at these fat levels support both performance and health without the risks of extreme leanness. Athletes approaching the athlete range (below 14% men, below 20% women) should monitor hormonal and energy availability markers — fatigue, libido, mood, and menstrual regularity in women — and ensure that training performance is maintained, as these are the early indicators that body fat has reached a level that is impacting physiological function beyond acceptable limits for long-term health.
Waist Circumference as a Health Indicator
Waist circumference — measurable with a $5 tape measure — is the most clinically validated single body measurement for metabolic health risk assessment, because it directly estimates visceral fat accumulation that total body fat percentage cannot isolate. The risk thresholds from international health guidelines: for men, waist circumference above 94cm indicates increased metabolic risk; above 102cm indicates high risk. For women, above 80cm indicates increased risk; above 88cm indicates high risk. These thresholds are not absolute — taller individuals and those with larger frame sizes can have larger waist circumferences without equivalent metabolic risk — but they provide the accessible first-screen indicator that identifies athletes for whom visceral fat reduction should be a priority. Measuring correctly: stand relaxed, exhale normally, measure at the midpoint between the lowest rib and the iliac crest (top of the hip bone) — typically at or just above the navel level. Measure at the same point consistently using the same technique. The waist-to-height ratio (waist circumference divided by height, both in the same units) provides a frame-size-adjusted metabolic risk indicator — a ratio above 0.5 indicates increased metabolic risk across sex and height ranges, with the simple rule “keep your waist circumference to less than half your height” being the most memorable application of this evidence-based guideline.
The body fat measurement practice, maintained with this level of methodological consistency and interpretive sophistication, provides the objective body composition intelligence that transforms intuition-based fitness management into the data-informed, systematically improving practice that produces the lasting body composition outcomes that less rigorous approaches consistently fail to achieve. Measure accurately, track consistently, interpret intelligently, and act decisively — this is the complete body fat measurement practice that works.
4. Tracking Body Composition Changes Over Time: The Right Approach
A single body fat measurement provides a snapshot; a series of measurements taken consistently over months provides the trend data that reveals whether training and nutrition are producing the intended body composition changes. The tracking methodology — measurement frequency, conditions, and interpretation — determines whether the data motivates and guides or confuses and discourages.
Measurement Frequency and Conditions
Monthly body fat measurement provides the optimal balance between measurement frequency and the detectable change magnitude that meaningful tracking requires. Body fat percentage changes of 0.5–1% per month represent good progress for most athletes — changes smaller than this fall within the measurement error of most home methods and cannot be reliably detected as genuine change versus measurement variability. Measuring more frequently than monthly does not provide additional useful information and creates the noise-interpretation problem that daily weighing produces on the scale. The standardized measurement conditions that minimize variability: always measure in the morning after voiding and before eating or drinking; avoid measuring within 24 hours of intense exercise (exercise-induced muscle swelling and glycogen changes affect skinfold thickness and BIA readings); avoid measuring during the week before menstruation in women (hormonal water retention affects body weight and BIA readings significantly); and use the same measurement method, same equipment, and same measurement site locations for every assessment. The consistency of conditions matters more than the absolute accuracy of any single method — a BIA scale that consistently overestimates body fat by 3% still provides reliable trend information if measured under the same conditions each time, because the systematic error is constant and the trend reflects genuine fat change. Photograph your measurement conditions (time of day, hydration protocol, equipment settings) to ensure month-to-month consistency.
Interpreting Progress: What Good Results Look Like
Realistic body composition change rates — informed by the physiological limits of fat loss and muscle gain — prevent the frustration of expecting faster progress than biology allows and the discouragement that unrealistic expectations produce. Fat loss rate in athletes: 0.5–1% of body weight per week is the evidence-supported range that maximizes fat loss while minimizing muscle loss — for an 80kg athlete, this is 400–800g per week. Expressed as body fat percentage change: 0.3–0.7% reduction per month is realistic for a consistent 500-calorie daily deficit with appropriate resistance training. Muscle gain rate in natural athletes: 1–2kg per year in experienced athletes (2+ years of consistent training), 4–8kg per year in intermediate athletes (1–2 years), 8–12kg per year in beginners (first year). These rates explain why body recomposition — simultaneous fat loss and muscle gain — produces small monthly body fat percentage changes (often 0.2–0.5% per month) that require 3–6 months of consistent measurement to confirm as genuine trend rather than measurement variability. The 3-month rolling average of body fat measurements — averaging the three most recent monthly readings — provides a more statistically robust trend indicator than any single reading, smoothing the month-to-month variability that even consistent measurement technique produces. From NSCA body composition tracking guidelines, athletes should evaluate body composition progress quarterly rather than monthly for the most reliable trend assessment — monthly measurements are valuable for maintaining measurement habit and detecting significant changes, but the quarterly trend provides the most actionable progress evaluation.
Combining Multiple Metrics for Complete Body Composition Tracking
The most complete home body composition tracking system uses three complementary metrics that each capture different aspects of body composition change: body fat percentage (from the primary chosen measurement method — caliper, BIA, or Navy formula); body weight 7-day average (smoothing the daily fluctuations into a weekly trend); and circumference measurements at standardized sites (waist, hips, chest, arms, thighs — capturing the redistribution of fat and muscle that overall body fat percentage averages across). The circumference measurements are particularly valuable for athletes whose body weight is stable (body recomposition) — as fat is lost and muscle gained in the same total mass, overall weight and even body fat percentage may change minimally while the circumference changes reveal the redistribution: waist circumference decreasing as abdominal fat reduces; arm and thigh circumferences increasing or maintaining as muscle develops in these areas. Monthly progress photos — front, side, and back views under identical conditions — provide the visual confirmation of circumference changes that numbers alone cannot communicate. The combination of these three metrics — percentage, circumference, and photographic — provides a body composition tracking system that is more sensitive to genuine change, more motivating through the visual record, and more informative about the type and location of body composition change than any single metric alone.
Beyond the numbers themselves, the body composition tracking practice develops a form of physical self-literacy — an increasingly accurate intuitive understanding of how the body responds to training, nutrition, sleep, and stress — that experienced athletes describe as one of the most valuable outcomes of systematic monitoring. The athlete who has tracked body fat percentage monthly for two years knows, before measuring, approximately where their fat percentage is based on how they feel, how their clothes fit, how training performance is trending, and how recovery quality has been. This intuitive calibration — developed through the iterative feedback loop of prediction, measurement, and comparison — is the advanced outcome of the monitoring practice that beginner trackers cannot yet access but consistently report developing after 12–18 months of consistent measurement and interpretation. The measurement data, interpreted thoughtfully over time, becomes the teacher that develops the body composition intelligence no textbook can directly provide. Commit to the practice, maintain the consistency, and allow the months of accumulated data to develop the physical self-knowledge that transforms how you understand, manage, and optimize your body for the athletic life you are building.
The circumference tracking component deserves particular attention for athletes in body recomposition phases — the waist-to-hip ratio (waist circumference divided by hip circumference) is a validated indicator of fat distribution pattern that predicts cardiovascular risk independently of total body fat percentage. Values above 0.90 for men and 0.85 for women indicate the apple-shaped fat distribution associated with visceral fat accumulation and elevated cardiovascular risk — and this ratio can improve (decrease) as training and dietary practices shift fat distribution from central to peripheral even when total body fat percentage changes minimally. Tracking this ratio monthly alongside total fat percentage provides the additional dimension of fat distribution change that total percentage alone cannot reveal. Similarly, tracking the arm and thigh circumferences alongside the waist provides the indicator of muscle development in these areas — circumference maintaining or increasing in the limbs while waist circumference decreases is the circumference signature of successful body recomposition, confirming that the body composition changes are occurring in the desired direction (muscle up, fat down) even when the scale weight changes minimally and body fat percentage changes are within measurement error range. This multi-site circumference tracking, combined with monthly body fat percentage and weekly weight averaging, provides the most complete home body composition monitoring system achievable without expensive equipment — and the information this system generates is sufficient to guide evidence-based training and nutrition decisions across the full body composition change journey from initial fat loss through maintenance and into the lean gaining phases that advanced body composition development requires.
5. Common Measurement Mistakes, Body Fat Myths, and FAQs
Body fat measurement is surrounded by misconceptions about accuracy, healthy ranges, and the relationship between fat percentage and health outcomes. Addressing these directly prevents the misinterpretation that derails athletes who are making genuine progress but reading their measurements incorrectly.
The Most Common Measurement Mistakes
Measuring at inconsistent times: the most common and impactful mistake — measuring body fat after eating, after exercise, or at different hydration states across months produces variation that reflects conditions rather than genuine fat change. Measuring before eating and before exercise, every time, eliminates this error source. Using multiple methods interchangeably: BIA, calipers, and the Navy formula produce different readings for the same body, because each method measures different proxies for body fat with different systematic biases. Switching methods mid-tracking creates false trend impressions — always use the same method and compare only within-method readings. Over-interpreting single readings: any single measurement contains both genuine fat percentage information and random measurement error. A single reading 1% higher than last month’s reading could reflect 1% genuine fat gain or could reflect 1% measurement error from slightly different conditions. Only the 3-month trend reliably distinguishes genuine change from measurement variability. Comparing to population norms without age and sex adjustment: a 45-year-old woman comparing her body fat percentage to the 25-year-old athlete norms will consistently find herself in a “worse” category despite being healthy and fit for her age — always use age- and sex-matched reference ranges for context. From International Journal of Obesity research on body composition assessment, the most significant source of home body fat measurement error is not equipment quality but measurement protocol inconsistency — standardizing conditions produces more reliable trend data than upgrading to more expensive equipment.
Body Fat Myths Debunked
Myth: “You can spot-reduce fat from specific areas.” Fat loss is systemic — the body determines fat mobilization patterns based on genetics, hormones, and regional fat receptor density, not based on which muscles are exercised. No exercise reduces fat in the specific body region being worked. Core exercises strengthen abdominal muscles but do not selectively reduce abdominal fat — the visible definition from these exercises emerges only when total body fat reduces sufficiently to reveal the underlying muscle. Myth: “Muscle turns into fat when you stop training.” Muscle and fat are distinct tissue types that cannot convert into each other — muscle atrophies (decreases in size and protein content) from disuse, and fat accumulates from caloric surplus, but no biological mechanism converts muscle cells into fat cells. The appearance of muscle “turning to fat” in former athletes reflects the simultaneous atrophy from training cessation and fat accumulation from continued caloric intake without the energy expenditure that training provided. Myth: “BMI accurately reflects body fatness in athletes.” As described earlier, BMI conflates muscle and fat mass in a single weight-to-height ratio that misclassifies muscular athletes as overweight — body fat percentage is the appropriate metric for athletes. Myth: “Very low body fat is always healthier.” Below the essential fat range (below 5% for men, below 12% for women), fat deficiency impairs hormonal production, immune function, and organ cushioning — very low body fat in athletes is associated with increased injury risk, hormonal disruption, and impaired recovery, not superior health.
Frequently Asked Questions About Body Fat Measurement
Which home method is most accurate? Skinfold calipers in experienced hands produce accuracy within 3–4% of DEXA — comparable to or better than consumer BIA devices. The Navy formula performs similarly well in non-extreme body types. Accuracy matters less than consistency — pick one method and use it consistently. How much does body fat percentage change with hydration? BIA readings can vary by 2–4% from dehydration alone — always measure under standardized hydration conditions. Calipers and tape-based methods are less sensitive to hydration. Can I measure body fat myself or do I need someone to help? The Navy formula and BIA scale are fully self-administered. Calipers at most sites require some flexibility but can be self-administered with practice using a mirror for guidance on the back sites. My body fat went up 1% this month but I feel leaner — is the measurement wrong? Possibly. Month-to-month variation of 1% is within the measurement error of most home methods — evaluate the 3-month trend rather than single-month changes. Also assess whether you measured under exactly the same conditions. What is a realistic body fat goal for a recreational athlete? For men: 12–17% provides the combination of visible muscle definition, good health markers, and sustainable maintenance that most recreational athletes target. For women: 20–25% achieves similar goals. These ranges are achievable through consistent training and moderate dietary discipline without the extreme restriction that competitive leanness requires. How do I know if my body fat measurement device is accurate? Compare it against a DEXA scan — measure on the home device the same morning as a DEXA assessment and calculate the personal correction factor. Apply this correction to all future home measurements to improve absolute accuracy while maintaining the trend reliability that consistent measurement provides.
Advanced Body Composition Tracking for Serious Athletes
Athletes who compete in weight-class sports (powerlifting, weightlifting, combat sports) or whose athletic performance is directly affected by body composition require more sophisticated tracking than recreational athletes pursuing general health and aesthetics. The advanced tracking system: monthly DEXA scans during the competition preparation phase (the last 8–12 weeks before the target weigh-in or competition) provide the gold-standard body composition data that allows precise peaking — reducing to the minimum body fat that supports peak performance without crossing into the hormonal and recovery impairment territory that excessive leanness produces. The in-season monitoring protocol: weekly morning body weight (7-day average), monthly Navy formula or caliper assessment, and quarterly DEXA scan provides the layered assessment frequency that catches composition drift early while avoiding the measurement burden of daily comprehensive assessment. The performance correlation tracking: recording key performance metrics (1RM strength, training session RPE, recovery ratings, sleep quality) alongside body composition measurements reveals the individual relationship between fat percentage and performance for each athlete — identifying the personal body fat range where performance is optimized, rather than applying generic category ranges that do not account for individual variation. For masters athletes (40+), the age-related muscle loss that begins accelerating in the fourth decade makes lean mass tracking — specifically the lean mass component from DEXA — increasingly important alongside fat percentage, as the primary body composition concern shifts from fat accumulation toward lean mass preservation that performance and metabolic health both require.
Body Fat Measurement in the Context of Overall Health Assessment
Body fat percentage is one component of a complete health assessment — providing the adiposity dimension that complements the cardiovascular, metabolic, and functional assessments that a comprehensive health picture requires. The complete home health monitoring system for athletes: body fat percentage (monthly, primary method); resting heart rate (daily, via smartwatch or morning manual pulse check — trending downward indicates improving cardiovascular fitness; trending upward with unchanged training indicates accumulated fatigue, illness, or overtraining); blood pressure (monthly, available at most pharmacies for free or with a home cuff for $30–50 — the primary cardiovascular risk indicator that body fat measurement does not capture); waist circumference (monthly alongside body fat measurement — the visceral fat indicator that provides cardiovascular and metabolic risk context for the overall body fat percentage); and movement quality self-assessment (quarterly — noting joint pain, movement restriction, or functional decline that may indicate need for mobility intervention or medical consultation). This complete monitoring framework requires 15–20 minutes per month of active measurement time — an investment that provides far more actionable health and performance guidance than any single metric alone. The athlete who maintains this monitoring practice over years develops the personal health data history that reveals individual trends, seasonal patterns, and the early warning signals that allow intervention before minor issues become significant health problems. Body fat measurement is the beginning of this monitoring practice, not the entirety of it — integrating it with the other accessible metrics described here provides the complete, actionable health picture that informed athletic self-management requires.
When to Seek Professional Body Composition Assessment
Home body fat measurement methods are appropriate for ongoing trend monitoring and general health awareness — but several situations warrant professional assessment for the accuracy and clinical interpretation that home methods cannot provide. Seek professional DEXA assessment when: beginning a structured fat loss phase as a baseline measurement that calibrates all subsequent home measurements against a gold standard; suspecting that a home measurement method is providing systematically inaccurate readings (if BIA and calipers consistently disagree by more than 5%, a DEXA scan identifies which is more accurate for the individual); when body fat approaches the lower boundary of the healthy range (below 12% for men, below 18% for women) and clinical confirmation of fat percentage is important for health safety decisions; or when body composition data is needed for sports eligibility, medical clearance, or performance optimization purposes that require defensible measurement accuracy. Sports medicine physicians, registered dietitians with body composition specialization, and exercise physiologists at university sports science programs can provide professional body composition assessment along with the clinical interpretation and individualized guidance that the numbers alone cannot supply. The integration of professional assessment and home monitoring — using professional DEXA as the periodic calibration anchor and home methods for the monthly trend tracking between professional assessments — provides the most complete and cost-effective body composition monitoring system available to dedicated athletes.
The decision to measure body fat at home — and to maintain that measurement practice consistently across months and years — reflects a commitment to the objective self-knowledge that informed athletic development requires. The scale tells you how much you weigh; body fat percentage tells you what you are made of. The athlete who tracks both, interprets them together in the context of training performance and subjective wellbeing, and uses the data to guide evidence-based adjustments to training and nutrition possesses the body composition intelligence that transforms guesswork-based fitness into systematic, progressively improving athletic practice. Start with the method that best matches your budget and consistency capacity, commit to the monthly measurement habit, and allow the accumulating trend data to reveal the body composition trajectory that your current training and nutrition practices are producing — then use that information to refine, improve, and ultimately achieve the body composition goals that support both your athletic performance and your long-term health. The tools are accessible, the methods are validated, and the information is worth the 10 minutes per month that consistent measurement requires. Measure, track, interpret, and act — this is the cycle that converts body fat assessment from a vanity metric into the performance and health management tool it truly is.